Landscape & water ·
The line that gives the Netherlands its height
Picture a polder lying two metres below NAP. But below which water, exactly? The three letters after a height mainly tell you which measuring stick you are using to look at the Netherlands.
One agreement for the whole country
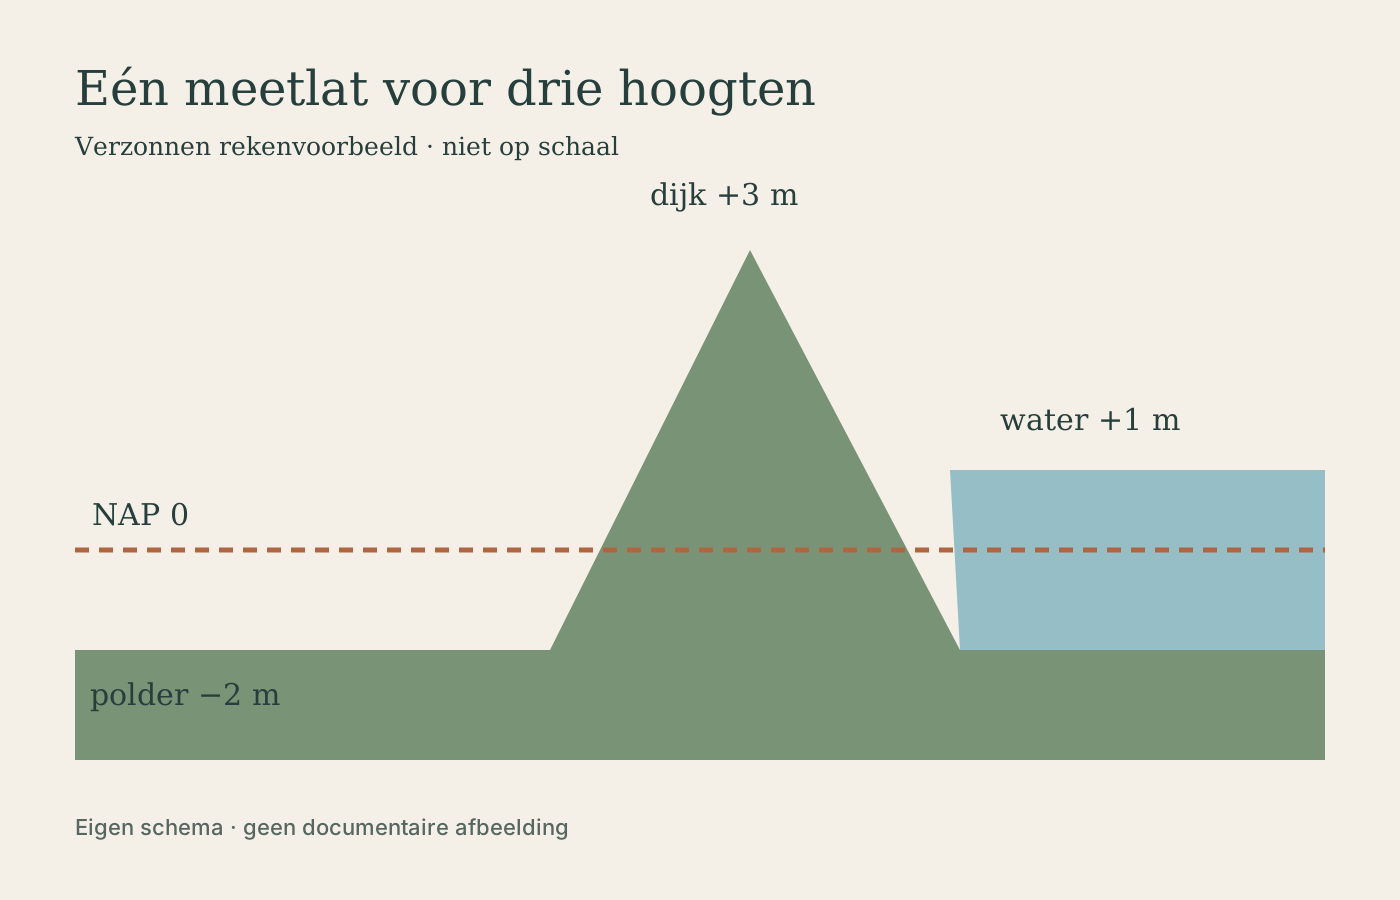
Take an imaginary polder, a dyke and a water level. The polder lies at −2 metres NAP, the top of the dyke at +3 and the water at +1. These are made-up values to show the difference. In this example, the dyke rises two metres above the water. The polder lies two metres below the agreed zero height. You have three numbers, but the same measuring stick each time.
Normaal Amsterdams Peil (NAP), the Amsterdam Ordnance Datum, is that shared height reference. Zero metres NAP lies roughly at the average level of the North Sea, as Rijkswaterstaat, the Dutch public works and water management agency, explains. It is not a waterline that follows every wave. You can set a measured water level against NAP; NAP itself does not tell you how high the water is standing at a particular dyke right now.
A benchmark links the measurements
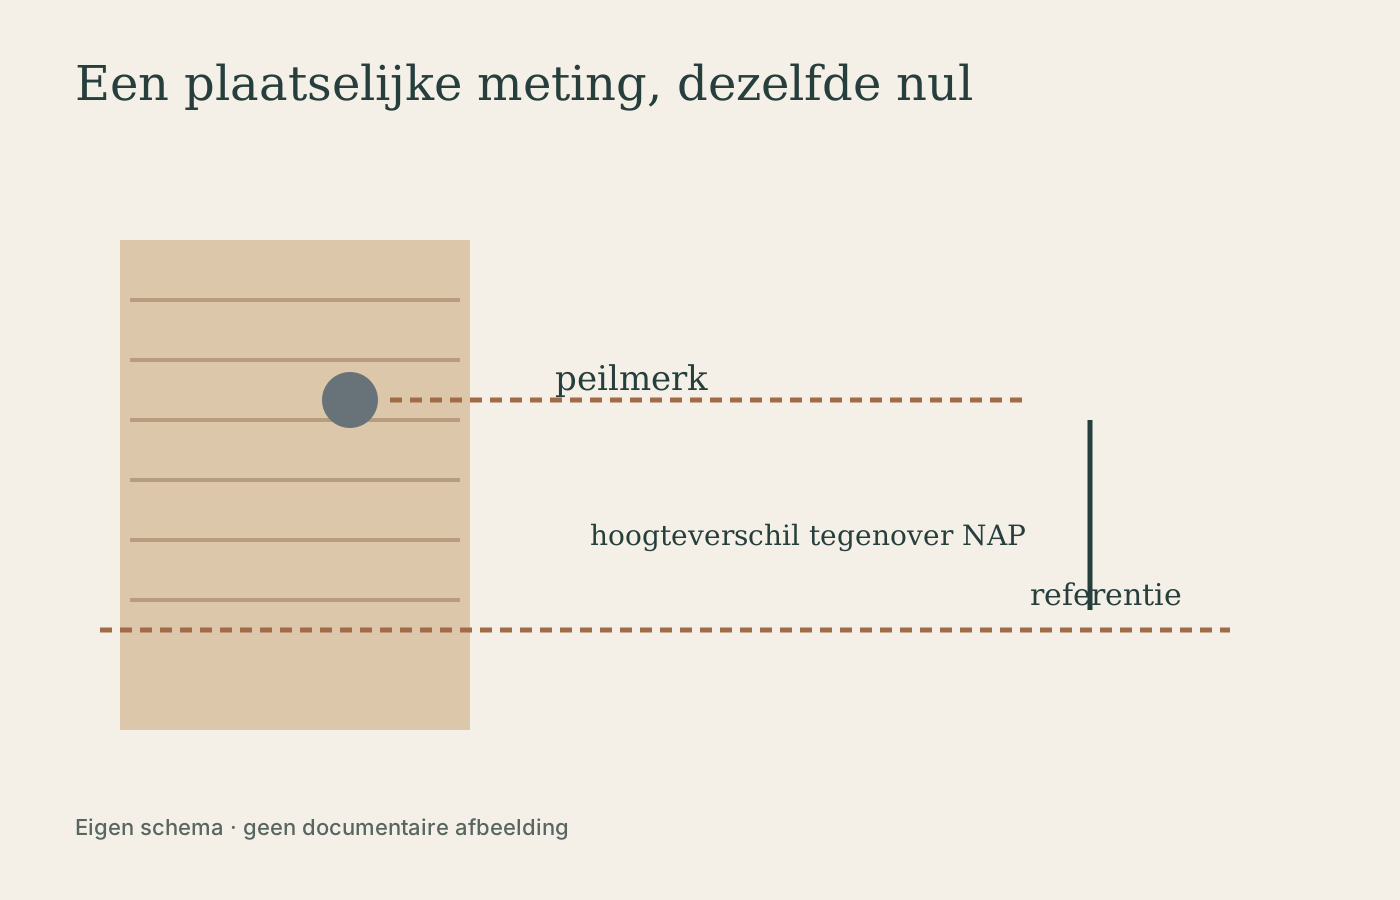
The agreement has to be traceable in real places. That is what benchmarks with a known height are for, anchored in houses, bridges and viaducts, among other places. Rijkswaterstaat measures and checks the network. A benchmark is therefore more than a marking: it links a measurement on the spot to the rest of the country.
Without such a common basis, a height figure would say little about another place. Three metres above the floor of a house is useful within that house. To compare it with a dyke further along, you also need to know where that floor itself lies.
A map with heights instead of street names
The Actueel Hoogtebestand Nederland (AHN), the up-to-date elevation dataset of the Netherlands, makes terrain heights visible in a digital map. Rijkswaterstaat describes the dataset as height data for cells of half a metre by half a metre, expressed relative to NAP. The data are publicly available and are used, among other things, for water drainage and for assessing dyke heights.
A height map is thus a way of asking the same landscape a different question: how high is it here? On its own, it does not answer whether a house will stay safe in a storm. In our polder example, almost everything needed for that is missing apart from the three height figures. The gain from NAP is more modest and very precise: at least you can compare those figures with each other.